
Wheel Bias Roulette: How Do You Detect It?
A biased wheel does not announce itself with a flashing sign — it leaks through micro-deviations in spin frequency that only surface when you strip the game down to its raw mechanical physics. Most players stare at the felt and never look at the rotor. That is exactly why the edge still exists for anyone willing to do the dirty work.
The detection problem is fundamentally a data problem. You are hunting for a sector of the wheel that lands more often than statistical randomness permits, and the only honest way to find it is to log thousands of outcomes and run the numbers until the noise collapses into signal. 🎯
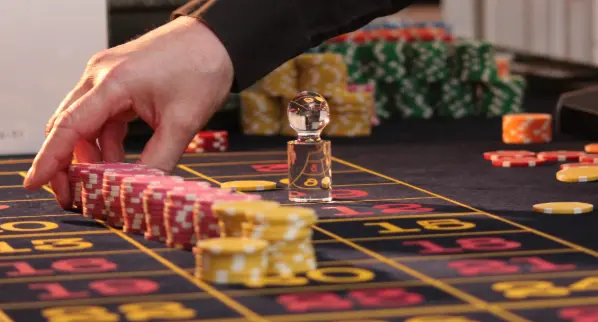
The Physics of Bias Before the Math
Before you touch a single spreadsheet, understand what actually creates bias. A wheel is a precision instrument with dozens of failure points: a worn fret that sits a millimeter off, a slightly loose turret bearing, a rotor that is not perfectly level, or a ball track with a microscopic groove. Any one of these defects shifts the landing distribution by a fraction of a percent per pocket — and that fraction is your entire edge.
The classic mechanically biased wheel is rare in modern casinos because manufacturers machine frets to tolerances tighter than a human hair and service intervals are aggressive. But “rare” is not “extinct.” Older wheels, secondary floors, and high-traffic tables with deferred maintenance still carry detectable drift. Your job is to measure it, not assume it. 🛠️
Building a Detection Dataset That Actually Works
You need a minimum sample of 3,000 to 5,000 spins before a chi-square test has any teeth. Fewer than that and you are chasing ghosts. Log the winning number, the sector, and if possible the ball’s drop zone and rotor speed at release. The sector-level data is where the wheel bias roulette signal lives — pocket-level analysis fragments your sample too thin to be statistically meaningful.
Map the wheel into eight sectors of roughly equal pocket count. Count hits per sector. Run a chi-square goodness-of-fit test against the uniform expectation. If your p-value drops below 0.05 on a 5,000-spin sample, you have a candidate. Below 0.01 and you are looking at something real. But here is the trap: multiple testing. Test eight sectors and one will look biased by pure chance roughly 34% of the time. Correct for it or you will bet your bankroll on noise. 📊

The Visual and Acoustic Shortcuts
Numbers are slow. Experienced auditors use their eyes and ears first. Watch the ball track for a consistent “stutter” where the ball decelerates unevenly — that points to a track defect. Listen to the rotor. A bearing on its way out produces a faint rhythmic tick that correlates with a specific angular position, and that position correlates with a landing sector. These are the tells that let you pre-qualify a wheel before you invest 40 hours of logging.
Also track dealer signatures. A croupier who releases with consistent velocity and spin direction can amplify a marginal physical bias into a playable wheel bias roulette exploit. Dealer consistency is not bias, but it is the multiplier that makes a weak bias profitable.
Separating True Bias from Dealer Signature
This is where most analysts blow it. They detect a sector skew and assume the wheel is defective, when the real cause is a dealer who always spins the same way. The fix is a control: log outcomes across multiple dealers on the same wheel. If the skew follows the dealer, it is signature. If it follows the physical wheel regardless of who spins, you have genuine mechanical bias — and that is the only version that survives dealer rotation and shift changes.
The final filter is economic. A detected bias is worthless unless the expected value per spin exceeds the house edge plus your logging cost. A 2% sector skew on a 2.7% house edge game is a loser. You need the skew to clear the edge by a comfortable margin before the wheel bias roulette detection pays for the hours you burned staring at a spinning rotor.